

Silver – A Technical Picture
By Justin Khoo
Silver has been trying to retest the intraday highs set on February 1, 2021, thanks to the Wallstreetbets crowd on Reddit. Unlike its counterpart Gold, which reached all-time highs, Silver fell significantly short of retesting its peak. It currently remains more than 50% below its all-time highs.
In this article, I will analyze the technical outlook for Silver across various time frames using Elliott Wave Theory.
Elliot Waves Theory is a technique of analyzing the markets by identifying specific characteristics of wave patterns, and it helps to make predictions based on the patterns. The price patterns are related to changes in investor sentiment & psychology. - Investopedia
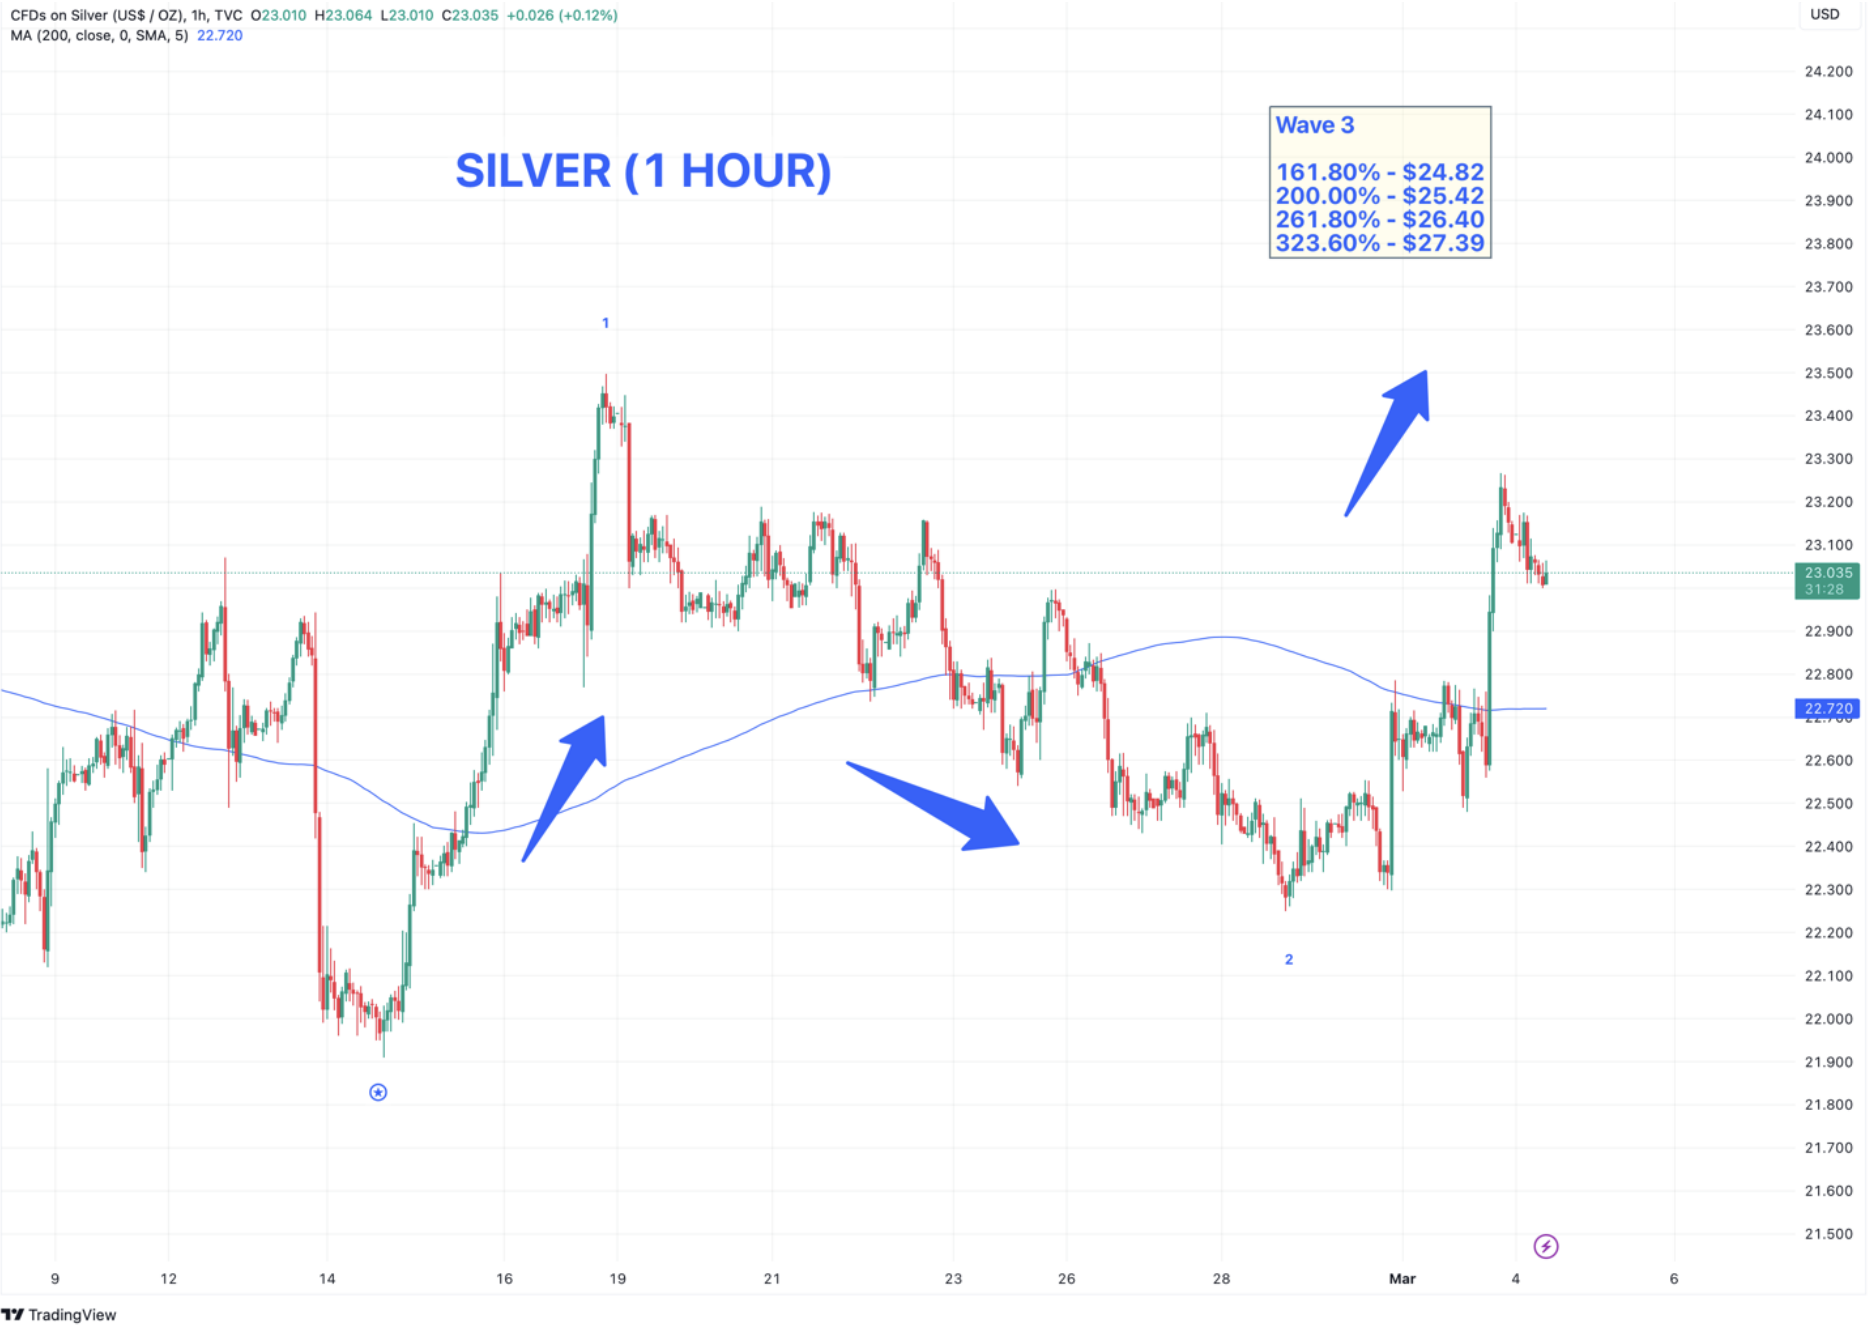
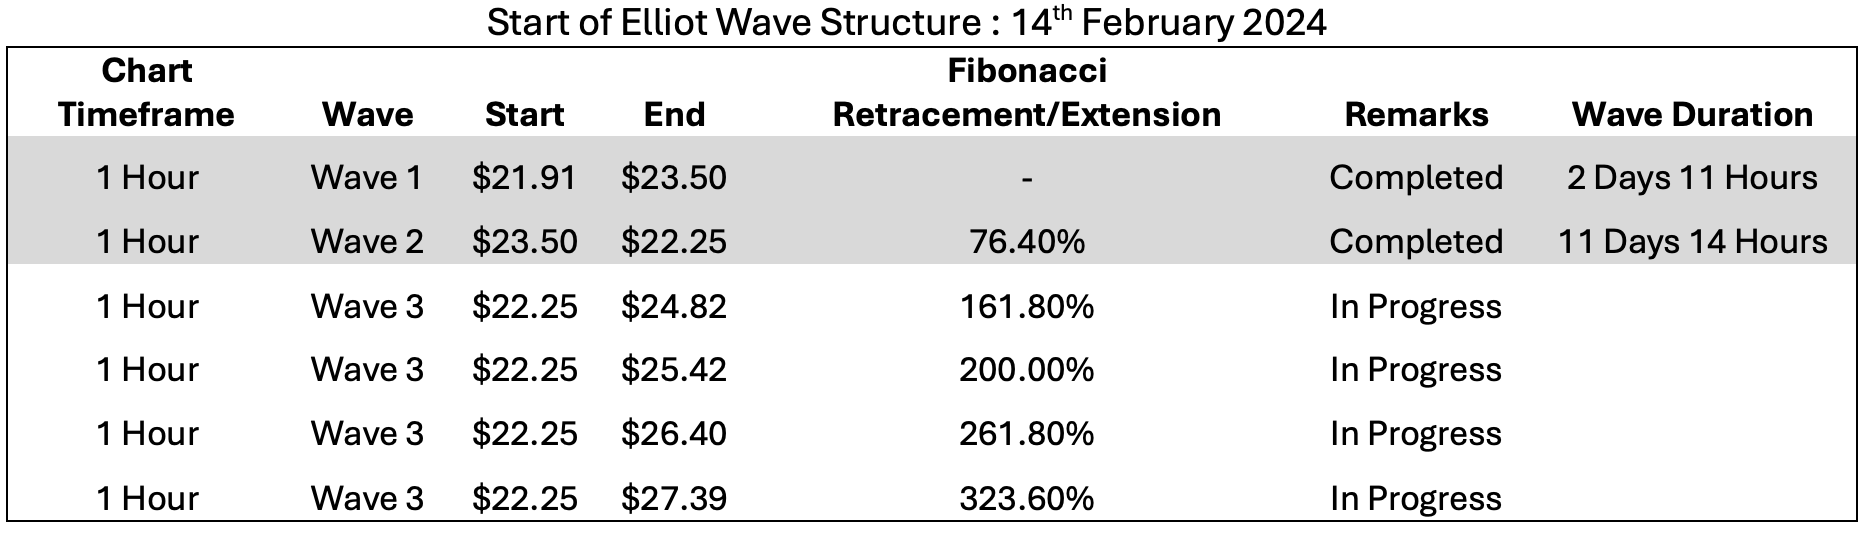
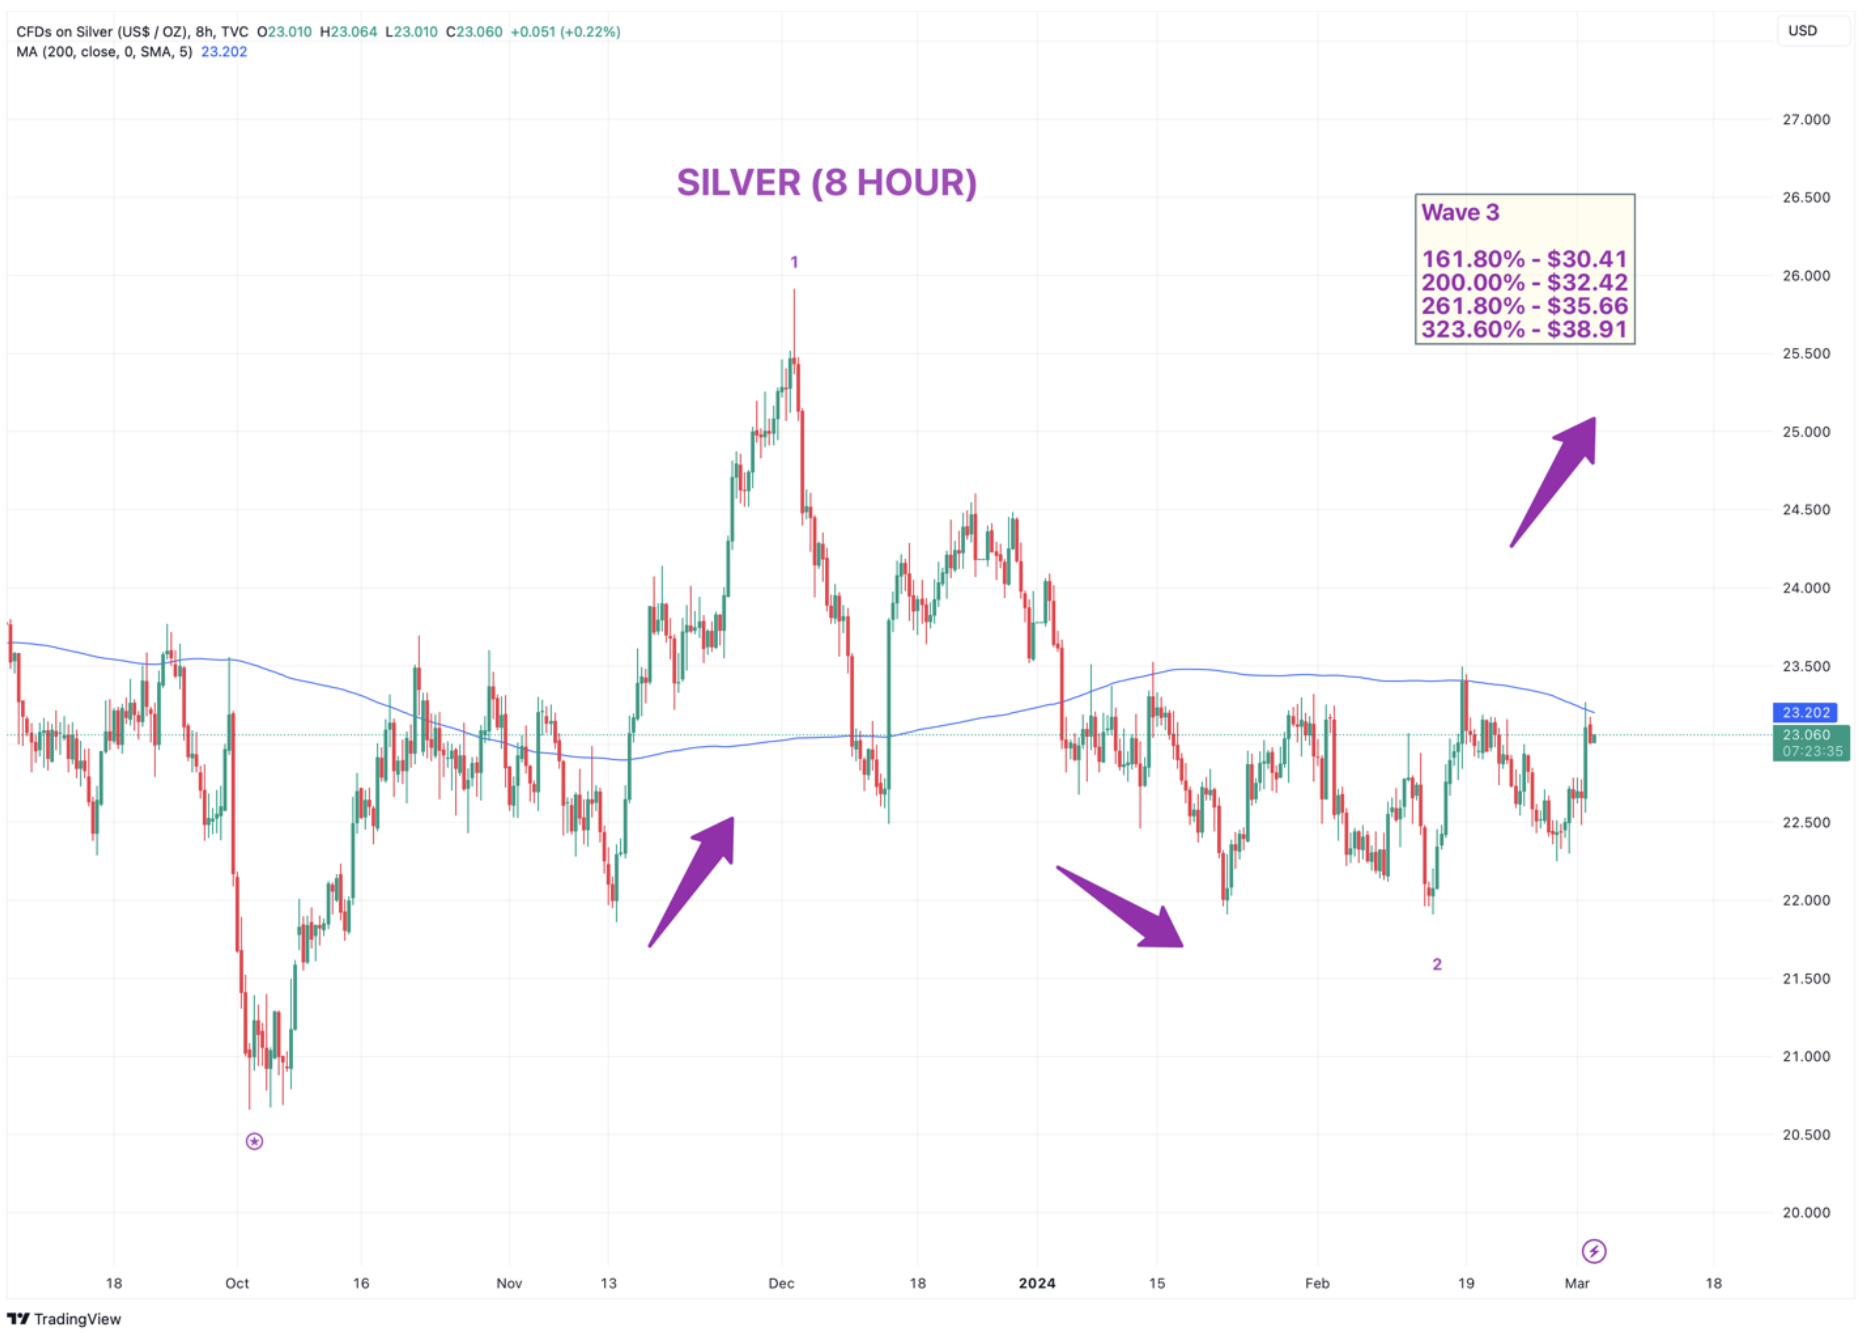
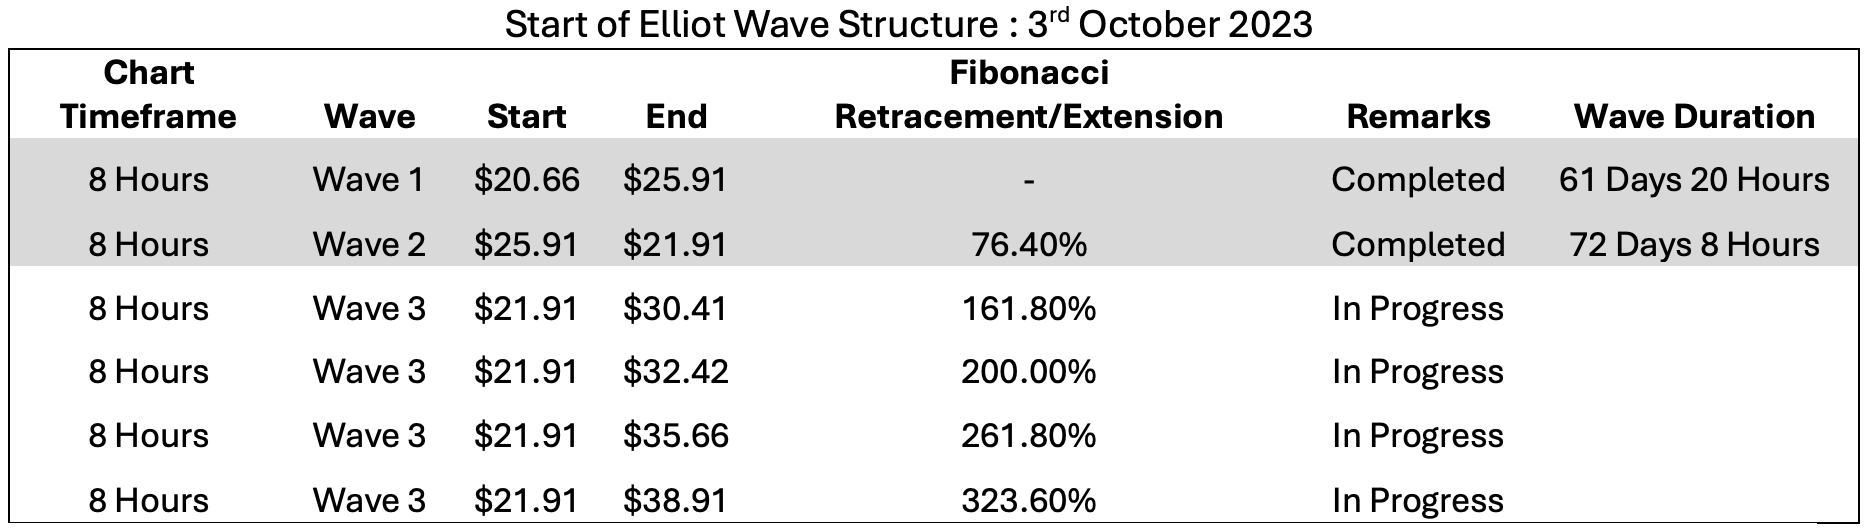
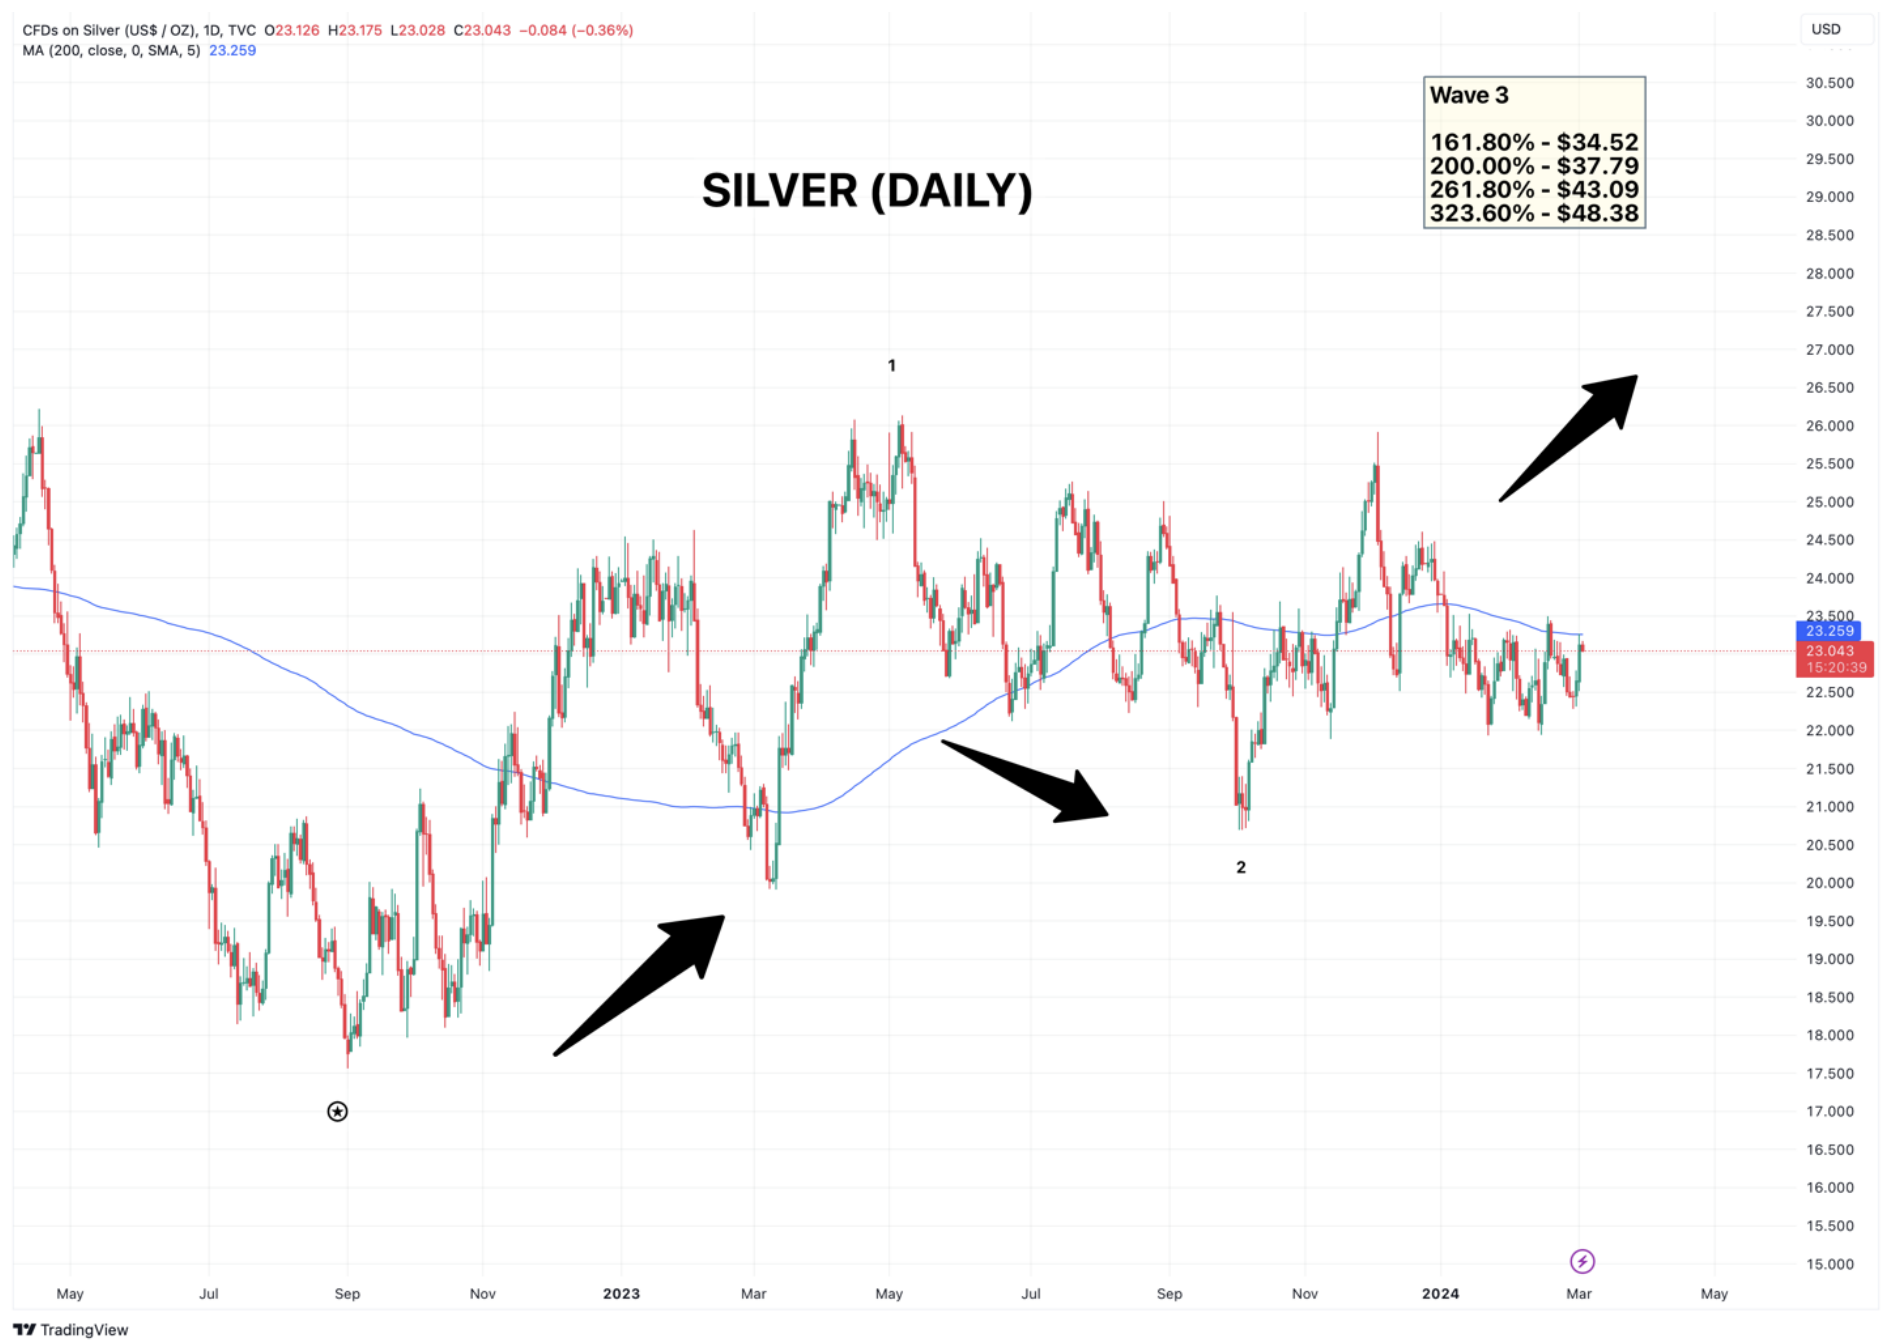
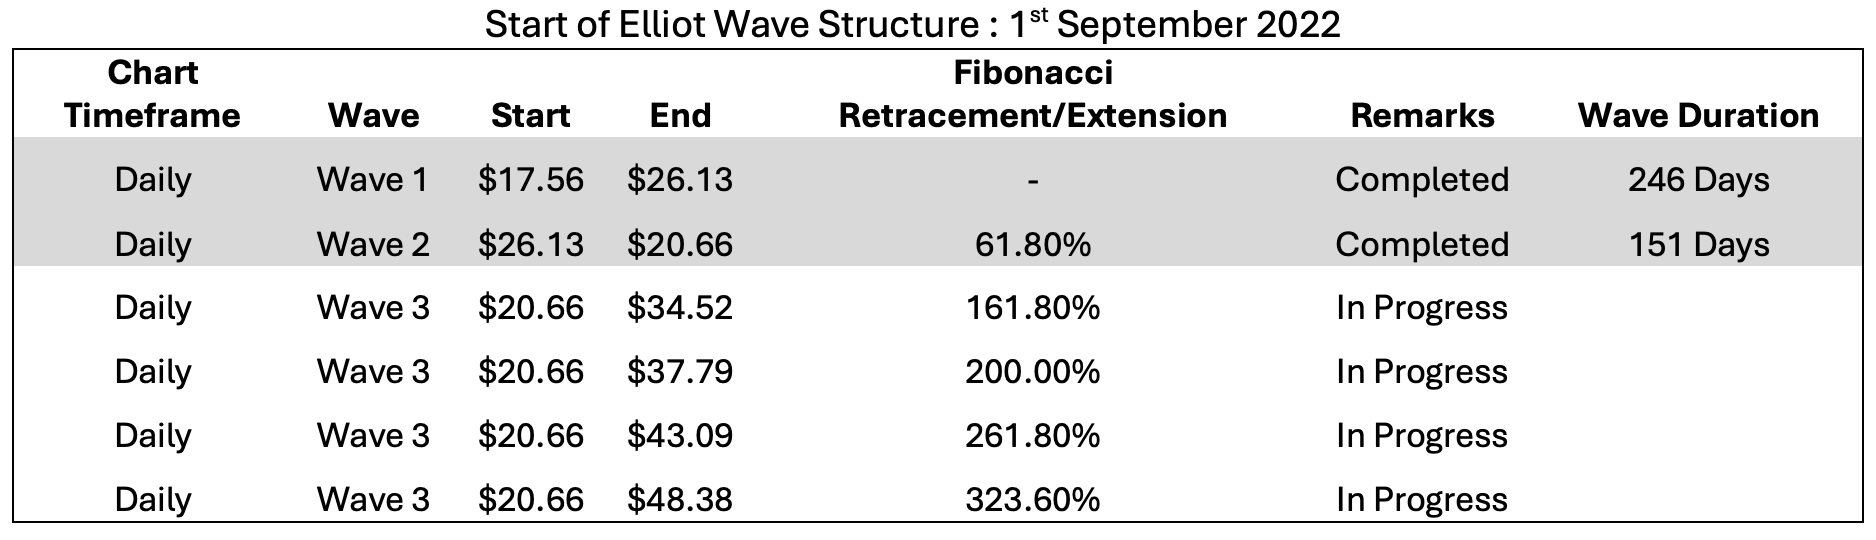
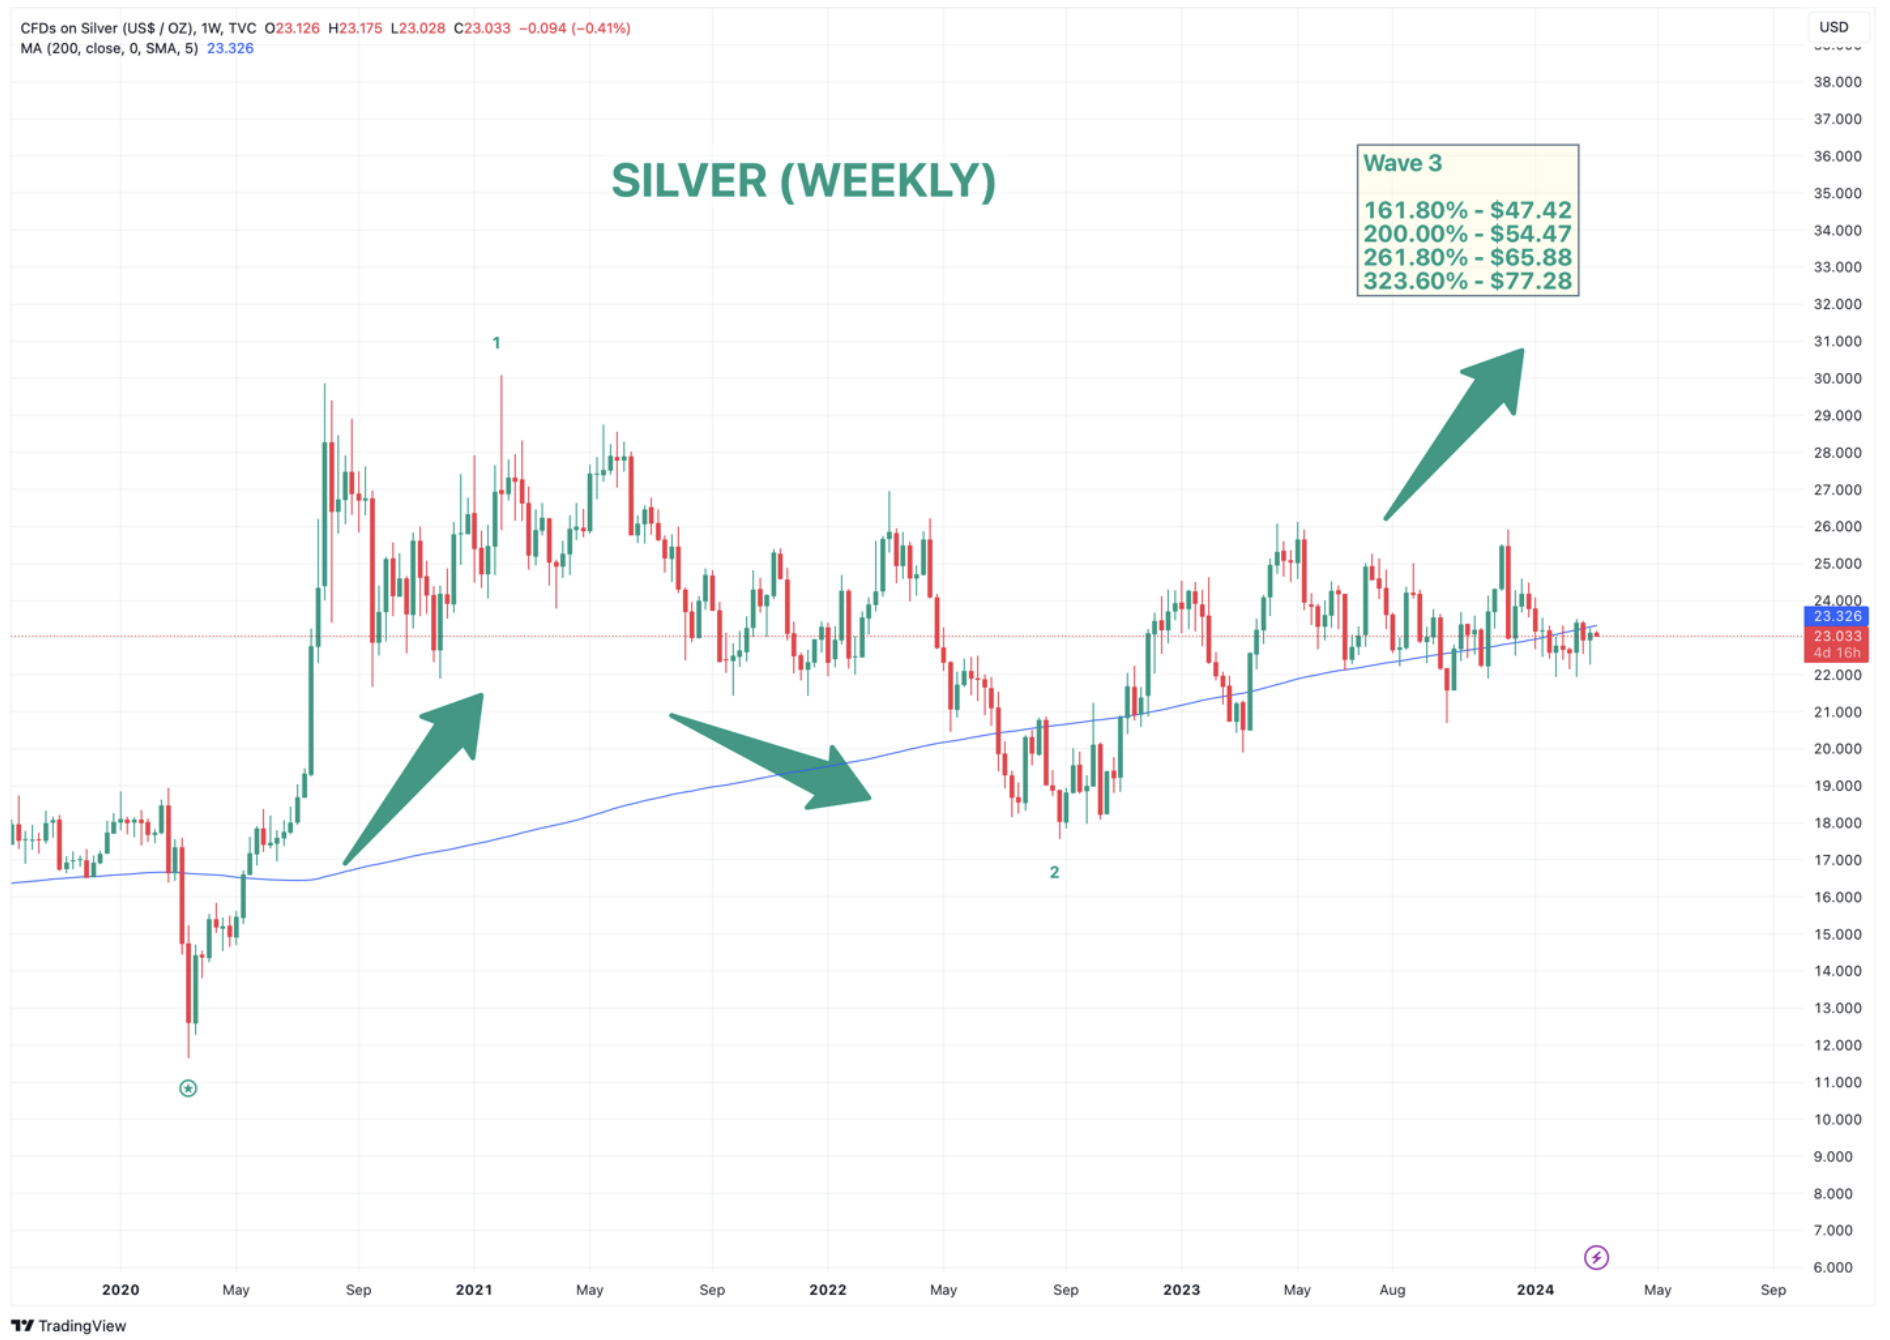
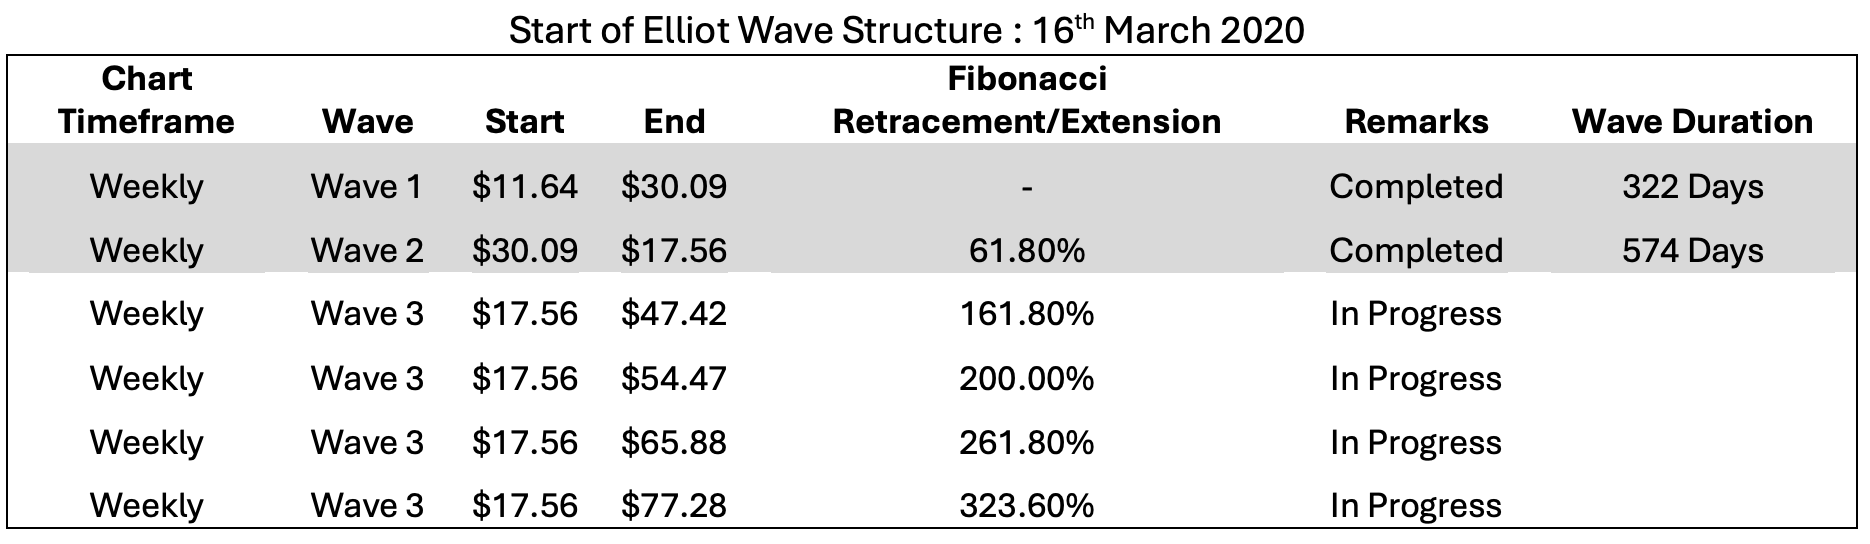
While current market sentiments may not support Silver, the technical charts suggest otherwise. Each timeframe depicted above marks a distinct starting point for the Elliot Wave Structure, all indicating that Silver is currently in Wave 3 of a 5 Wave impulse. Wave 3 is generally a robust and powerful wave.
Elliot Waves has guidelines & Fibonacci ratio relationships between all the waves, and prior to the start of the Wave 1 on all timeframes, the guidelines have been satisfied. Here are the guidelines for Wave 3 ;
• Wave 3 can not be the shortest wave of Wave 1, 3 & 5
• Wave 3 is 161.8%, 200%, 261.8%, or 323.6% of Wave 1-2
Considering this, Silver is expected to show a significant rally in the next 6-12 months. To all the frustrated Silver investors, hang in there.